No opinion, but some effect
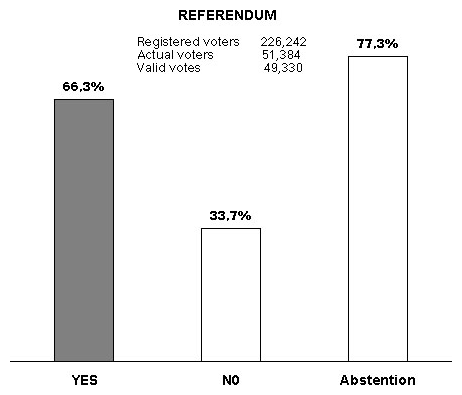
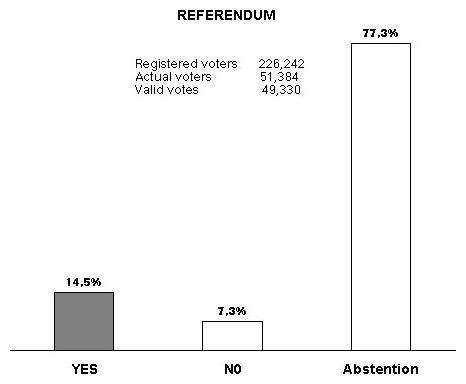
In November 1996, the Nice city government organized a referendum on its removal orders with regard (if we dare say...) to the homeless. Nice-Matin (a local daily paper) of November 25, 1996, reported the outcome of the vote using histograms, all on the same scale and with the same presentation, showing the percentage of abstentions (calculated on the basis of registered voters) and percentages of votes “for” and “against”, the latter two calculated on the basis of valid votes (figure 1). One’s visual impression was clearly that there were as many “for”, percentage-wise, as there were abstentions, whereas the truth was quite different. If the “for” and “against” columns were to be comparable to the abstention columns, they would have to be given as a percentage of registered voters, that is multiplied by the percentage of valid votes. This would produce figure 2, quite different from figure 1...
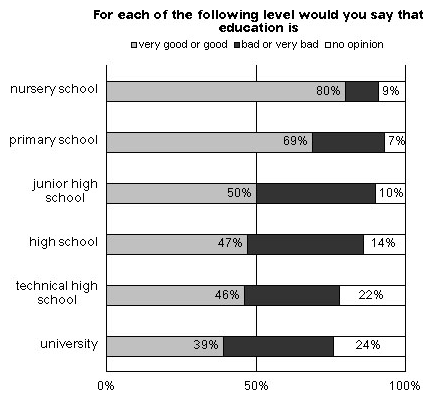
However, a graphically correct presentation of the findings may sometimes correspond to perfectly incorrect conclusions. For instance, at about the same time, (November 19, 1996) Le Monde (a national daily paper) reported on a SOFRES (a polling institute) survey of French opinions on the educational system. Figure 3 illustrated the rates of satisfaction expressed for the different levels of schooling.
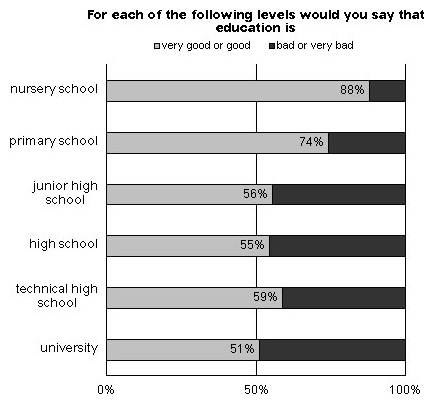
Le Monde’s comment was : “As we advance toward higher education, the degree of dissatisfaction and distrust increases [...]. 80 % of French people plebiscite nursery school [...], whereas a bare half (50 % of positive opinions) approve of junior high schools [...]. Only 39 % approve of higher educational institutions.” In point of fact, there is an illusion involved here, due simply to the fact that increasing numbers of people have “no opinion” as the level of the schools rises. This is really perfectly comprehensible, since experience with nursery school (“plebiscited”, in the words of Le Monde) is obviously much more wide-spread than experience with universities (“criticized”...). A very different result may be obtained simply by caculating the percentages of approval and disapproval on the basis of actually expressed opinions. In that case there would still be a majority of satisfied individuals (figure 4), and there would actually be relatively little variation in the proportion of those satisfied – at least for high schools and university.
Jean-Marc Lévy-Leblond
June 1997
Penumbra, 2001 June
- | Accessibilité |
- Informations légales |
- Plan |
- Contact

